Intro
Static code analysis is a widely used automated code inspection technique that identifies bugs, security vulnerabilities, code smells, and other issues in code that don't match your company's coding standards. It's performed early in the development process, helping improve code quality and maintainability.
Using tools like SonarQube Server for static code analysis helps you catch and fix code issues before they become major production problems. Finding coding issues early in the Software Development Life Cycle (SDLC) leads to more efficient and reliable software. Additionally, resolving issues earlier in the dev process saves time and is less costly than later during application testing or when applications are live in production.
In this article, you'll learn how static code analysis works, what it can do for the quality of your codebase, and how to run static code analysis using SonarQube Community Build and SonarQube for IDE.
What Is Static Code Analysis?
Static code analysis, also known as static program analysis, code scanning, or linting, is the automated process of examining source code without executing it. It detects various types of issues, such as unparsable syntax, non-imported modules, unreachable and unused code, duplicate code, potentially vulnerable code, leaked secrets, and violations of coding standards and conventions.
The following are the main reasons for performing static code analysis:
- Catch bugs before they affect production. Bugs found in the earliest stage of the SDLC are much cheaper to fix.
- Reveal security vulnerabilities and prevent them from being exploited in production.
- Improve maintainability by eliminating duplicate and unused code.
- Align code style between team members, making code review more focused on the intent rather than on cosmetic discrepancies.
- Help define the scope for addressing technical debt.
Static code analysis can be performed at various early stages of development. Linters apply live incremental code analysis, flagging errors and suspicious code as you type. Post-commit to the repository is another beneficial stage in the SDLC for running code analysis.
Sonar recommends running static code analysis checks in your local development environment with SonarQube for IDE and as part of your CI pipeline with SonarQube Server integrated into your choice of DevOps platforms. Doing both might seem redundant, but it serves two objectives. The first is to catch issues as early as possible in the IDE, minimizing rework. The second is to find deeply layered issues in code that are difficult to find in the IDE and are only discoverable in the repository when traversing all the project's code and its dependencies.
Implementing Static Code Analysis with SonarQube Server
SonarQube Server is a powerful and popular static code analysis tool that helps developers and teams identify and eliminate bugs, vulnerabilities, and code smells in over thirty languages, including Java, Python, Go, JavaScript, TypeScript, C, C++, and C#.
Integrating SonarQube Server into your workflow improves code quality and maintainability, ultimately aiding you in delivering a more reliable product to your users. Its comprehensive set of rules and customizable settings help you write cleaner, more efficient code while adhering to industry best practices.
SonarQube Server lets you perform static code analysis in various settings:
- Run code analysis across your entire code base on demand at any time.
- Set up code analysis to run every time you commit and push changes to your code repository on a DevOps platform, such as GitHub, GitLab, or Bitbucket.
- Enjoy instant code analysis feedback as you make changes in the IDE, such as JetBrains IDEs (IntelliJ), Visual Studio, VS Code, a JetBrains IDE, or Eclipse via SonarQube for IDE, an IDE extension that uses code-quality rules configured in SonarQube Server.
Let's see what it takes to perform static code analysis with SonarQube Community Build. Because SonarQube Server and Community Build are self-managed products, you'll need to decide where to host and install the server. Alternatively, you can use SonarQube Cloud if you prefer a cloud-hosted SaaS experience. In this walkthrough, we're demonstrating the installation of SonarQube Community Build since it does not require a license to run. The steps to install are identical for SonarQube Server but require the additional step of installing a license to start the analysis.
Installing SonarQube Community Build
You can skip this section if you already have a running SonarQube Server or Community Build instance.
SonarQube Community Build can be installed locally on your Windows, Mac, or Linux machine from a ZIP file or run as a container from a Docker image.
In this tutorial, you'll run SonarQube Community Build in a Docker container because it's an easy way to explore the platform and the most common way to run it. The other advantage is that when you switch to running in production, you can use the data in the database without starting over from scratch.
To run a Docker container on your local machine, you need to have Docker Desktop installed and running.
Next, create a new directory named `sq-community-build`. In it, create a directory named 'sq-logs' and a new file named 'docker-compose.yml' and paste the following script into the file:
version: "3"

services:
    sonarqube:
      image: sonarqube:community
      ports:
        - "9000:9000"
      depends_on:
        - db
      environment:
        SONAR_JDBC_URL: jdbc:postgresql://db:5432/sonar
        SONAR_JDBC_USERNAME: sonar
        SONAR_JDBC_PASSWORD: sonar
      volumes:
        - sonarqube_data:/opt/sonarqube/data
        - sonarqube_extensions:/opt/sonarqube/extensions
        - ./sq-logs:/opt/sonarqube/logs

    db:
      image: postgres
      ports:
        - 5433:5432
      environment:
        POSTGRES_USER: sonar
        POSTGRES_PASSWORD: sonar
        POSTGRES_DB: sonar
      volumes:
        - postgresql:/var/lib/postgresql
        - postgresql_data:/var/lib/postgresql/data

  volumes:
    sonarqube_data:
    sonarqube_extensions:
    postgresql:
    postgresql_data:
Alternately, you can also use our example docker-compose.yml file in GitHub. The script above is a little simpler for this exercise, so it's easier to explain.
Before we run the SonarQube Build, let's review a few things the above yml script defines so it's not a mystery.
First, it defines the service that runs SonarQube Community Build in a Docker container. Note the image is "sonarqube:community" and that it depends on a database. The db you'll be using is PostgreSQL, and you're telling SonarQube Community Build the login credentials for the db and the URL for the db, which includes the hostname, port, and schema for the db.
You define the three volumes SonarQube Community Build needs and a host port mapping to the container port, which is the port for accessing the web server you will use to interface with SonarQube Community Build. Notice that the script is defining a folder for storing the SonarQube Community Build logs. If you have any issues and need to look at the logs, you know where to find them. They'll be in 'sq-docker/sq-logs/'.
Next, the yml script defines the service to run PostgreSQL in another Docker container. The script defines the database's host port to container port mapping. You're giving it environment variables to set the login username and password that SonarQube Community Build used earlier. Additionally, the script sets up a schema in the db called 'sonar' that SonarQube Community Build will use. Finally, the script defines where to find the volumes the database needs to run. Lastly, the script defines the volumes required by both containers.
In your terminal, while in the directory 'sq-community-build', run the following command:
docker compose up
You'll see a lot of output explaining what's going on from SonarQube Community Build and PostgreSQL. When the output slows down, and you see the message, `SonarQube Community Build is operational,` open SonarQube Community Build in your browser at `localhost:9000/`. Log in with the default credentials username `admin` and password `admin`, then change the default password when prompted.
Getting to Know SonarQube Community Build
Once you've changed the default password, SonarQube Community Build will guide you through creating your first project. If your project is in a DevOps CI platform, you can set up an integration with it or configure SonarQube Community Build to analyze a project on your local machine.
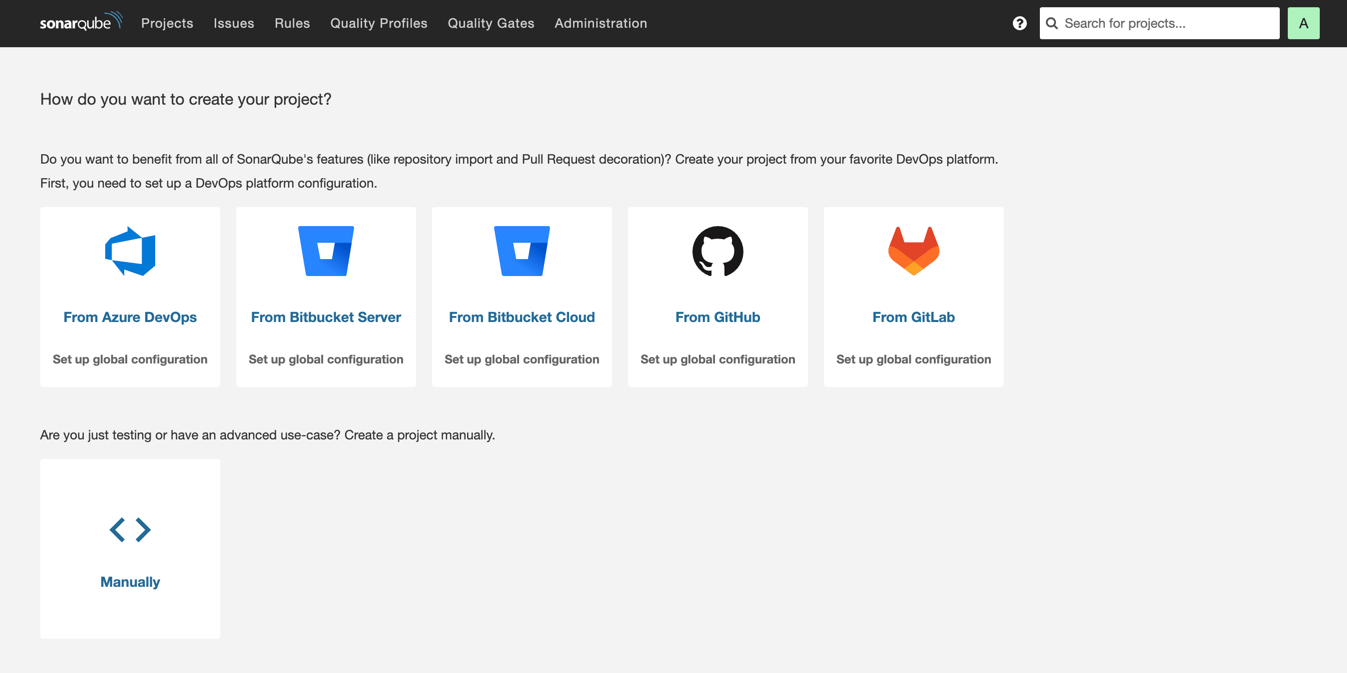
Before you set up and scan your first project, let's walk through the areas of this page to understand what SonarQube Community Build is showing you.
From the main part of the page, you can do one of the following:
- Connect SonarQube Community Build to a DevOps platform like GitHub, GitLab, Bitbucket, or Azure DevOps and specify a project in the repository to analyze. SonarQube Community Build will perform code analysis on the whole project and incrementally on every commit to the repository's main branch.
- Connect SonarQube Community Build to a local working copy of a codebase and run an on-demand code scan locally.
All the projects you add to SonarQube Community Build, including those you add using this wizard, will be accessible from the Projects section on SonarQube Community Build's navigation menu.
The other sections on the navigation menu include:
- Issues This section contains all of the issues SonarQube Community Build finds as a result of analyzing your projects. The issues are grouped by project and the file they were found in. Using the left-hand navigation, you can filter the list of issues to find what you are looking for.
- Rules This is a comprehensive list of all static code analysis rules available in SonarQube Community Build across all supported programming languages.
- Quality Profiles These are language-specific collections of rules applied during analysis. For each language, there's a default profile called Sonar way that contains the rules Sonar recommends for that language. You can create custom profiles to suit your company's needs, however the default Sonar way is most commonly used.
- Quality Gates This section lists all your quality gates. Quality gates contain the conditions that will cause a code scan to fail. The default quality gate, called Sonar way, includes a set of conditions based on the Clean as You Code methodology that Sonar advocates. It differentiates between old code and new code to ensure new code added after you've begun using SonarQube Community Build is free of bugs, security vulnerabilities, and technical debt and has proper test coverage. Like the quality profiles, you can create custom quality gates with conditions to match your company's policies, but the conditions preset by SonarQube Community Build are the norm.
Running SonarQube Community Build Analysis On Demand
In a production environment, you'd typically connect SonarQube Community Build to your DevOps platform and add the projects you want to scan. For the sake of brevity, let's see how to run a local on-demand code scan with SonarQube Community Build. To follow this exercise, you only need the running SonarQube Community Build and PostgreSQL Docker containers and a local copy of a project repository.
Let's use eShopOnWeb, a reference ASP.NET Core application, as a guinea pig. On GitHub, create your own fork of `eShopOnWeb` and clone it locally to your machine.
Go back to SonarQube Community Build's project creation screen, which should be available at `localhost:9000/projects/create` for a local installation. Click Manually to set up an on-demand analysis of the local working copy.
In the next screen, enter `eShopOnWeb` in Project display name. Click Set Up.
In the next screen, opt to analyze your local working copy by clicking Locally.
In the next screen called Analyze your project, under Provide a token, accept the default token options and click Generate. Once the token has been generated, click Continue.
Under Run analysis on your project, select .NET. Under Choose your build tool, keep .NET Core selected. SonarQube Community Build will display instructions on running further commands that are necessary to perform a local code scan:
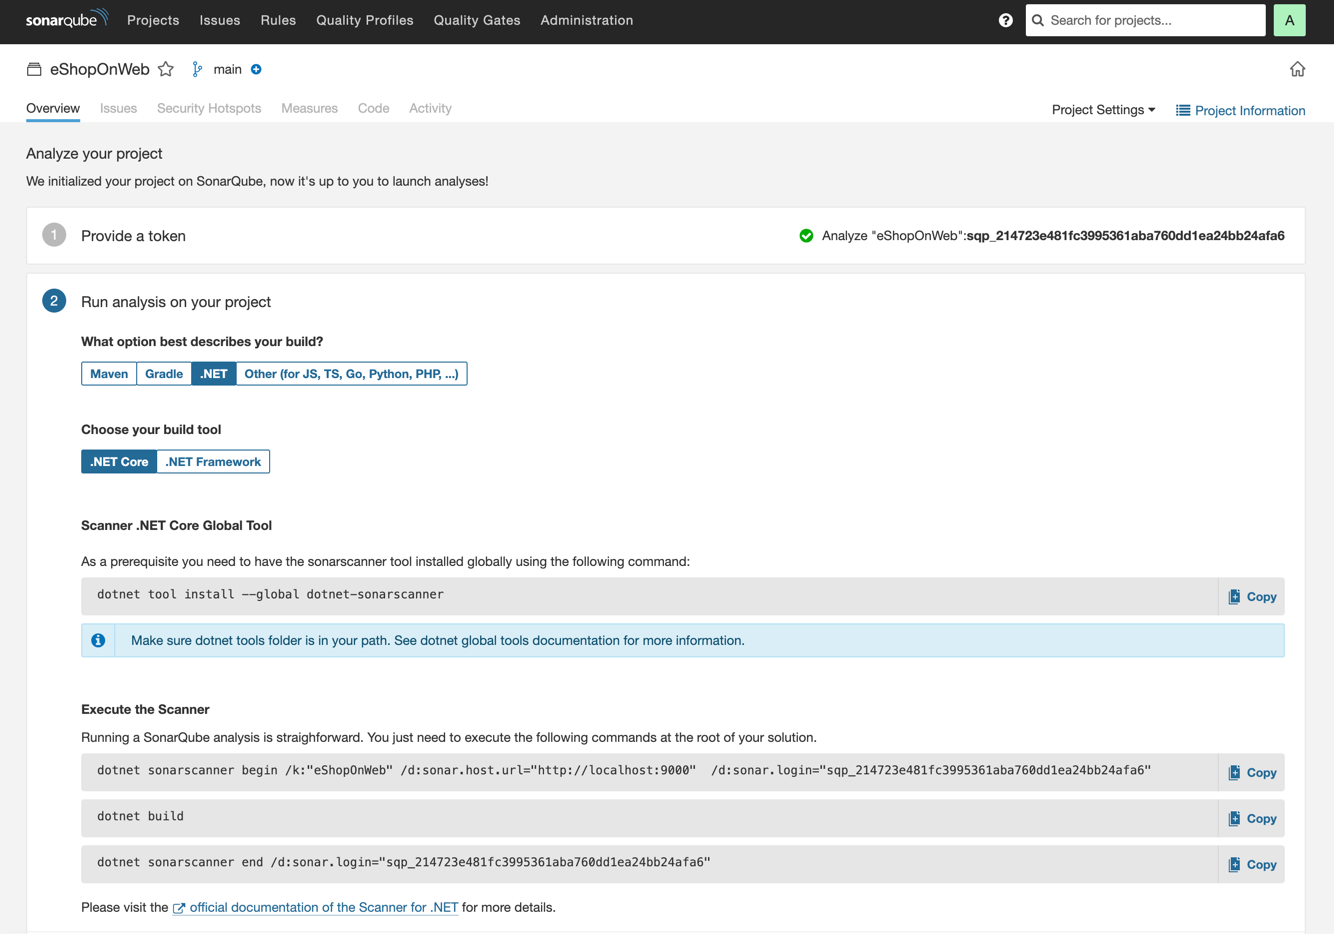
If you don't have a recent version of .NET installed on your machine, download and install .NET Core SDK to follow along.
Install SonarQube Community Build's Scanner .NET Core Global tool by running the following command in the terminal:
dotnet tool install --global dotnet-sonarscanner
If the command's output says that the .NET tools directory is not on your PATH environment variable, follow the instructions in the output to add it to your PATH.
In your terminal, open the root folder of your `eShopOnWeb` fork's local copy and run the three commands that SonarQube Community Build lists under Execute the scanner. Change the second of these commands, `dotnet build` to `dotnet build Everything.sln`.
As soon as all these commands are completed and results are sent back to your SonarQube Community Build installation, your SonarQube Community Build project page will display an overview of the results of the initial code scan:
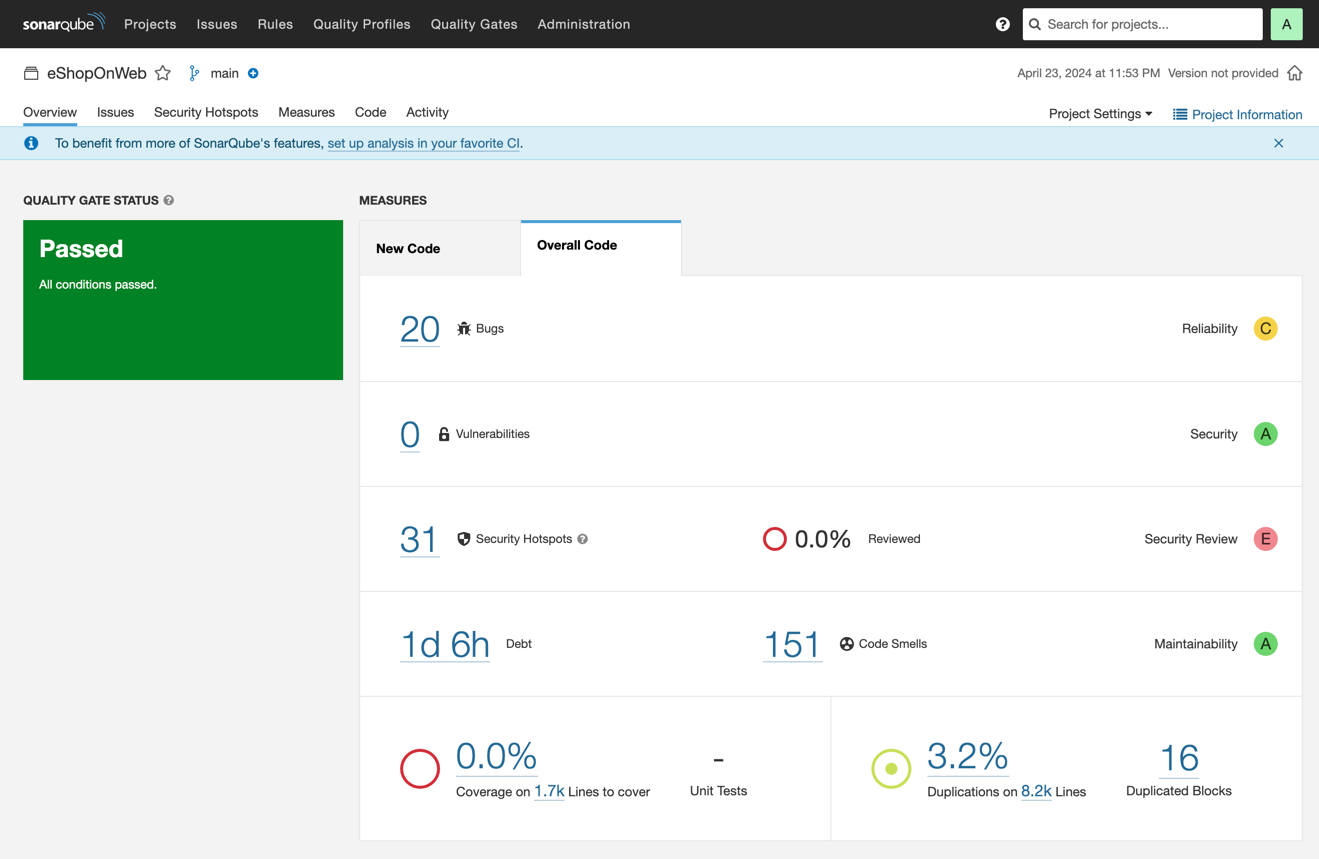
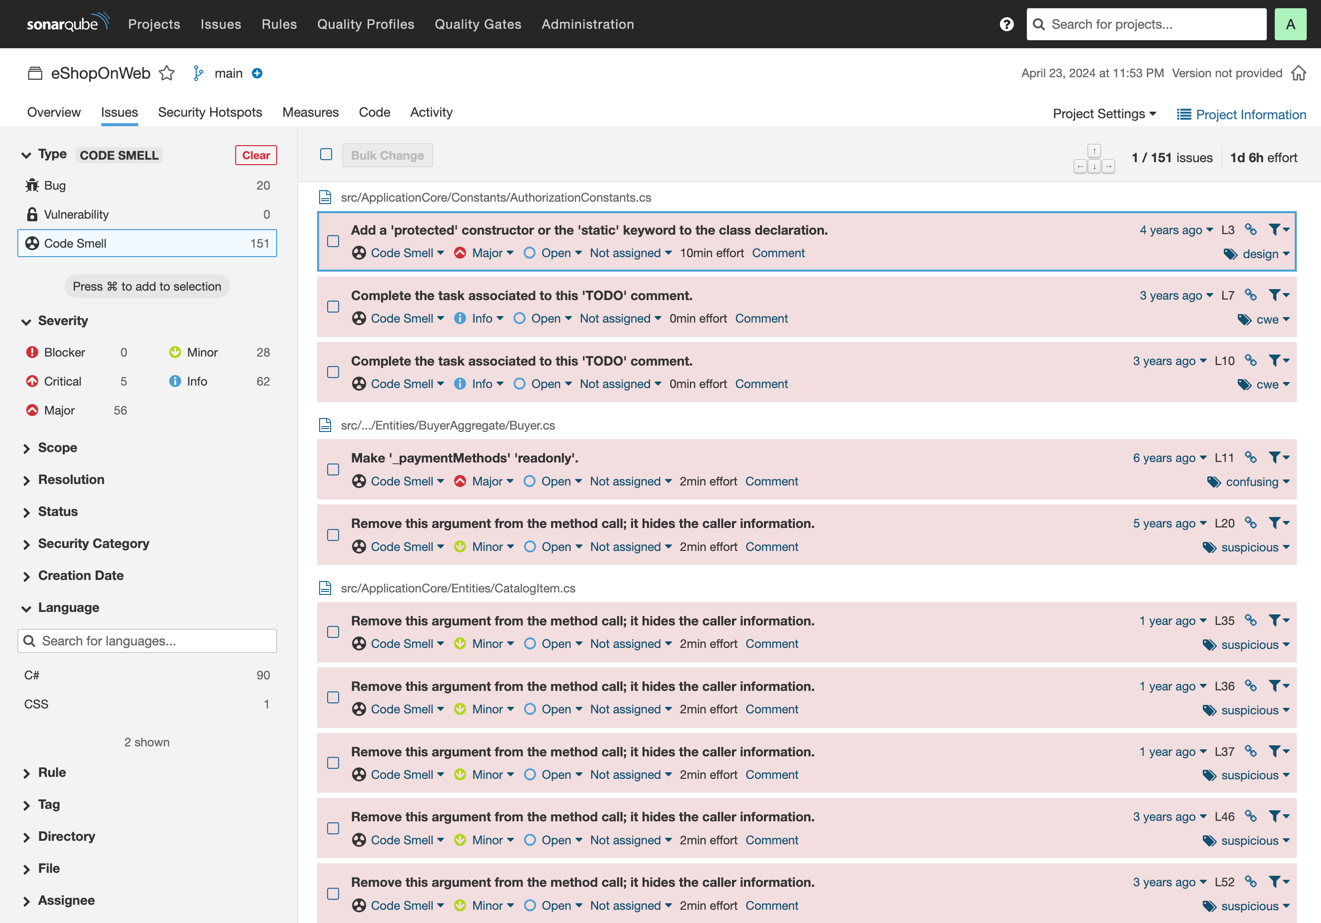
As you can see, SonarQube Community Build has detected 20 bugs, 31 security hotspots, and 151 code smells across the different languages used in `eShopForWeb`. If you click on the number of code smells in this overview, you'll see the list of specific problems. Clicking the Language filter on the left reveals which languages these code smells come from. In this case, most come from C# code, but one code smell is detected in a CSS file.
Returning to the project overview, you can see that the summary is for overall code. The New Code tab is empty because you've only performed an initial code scan:
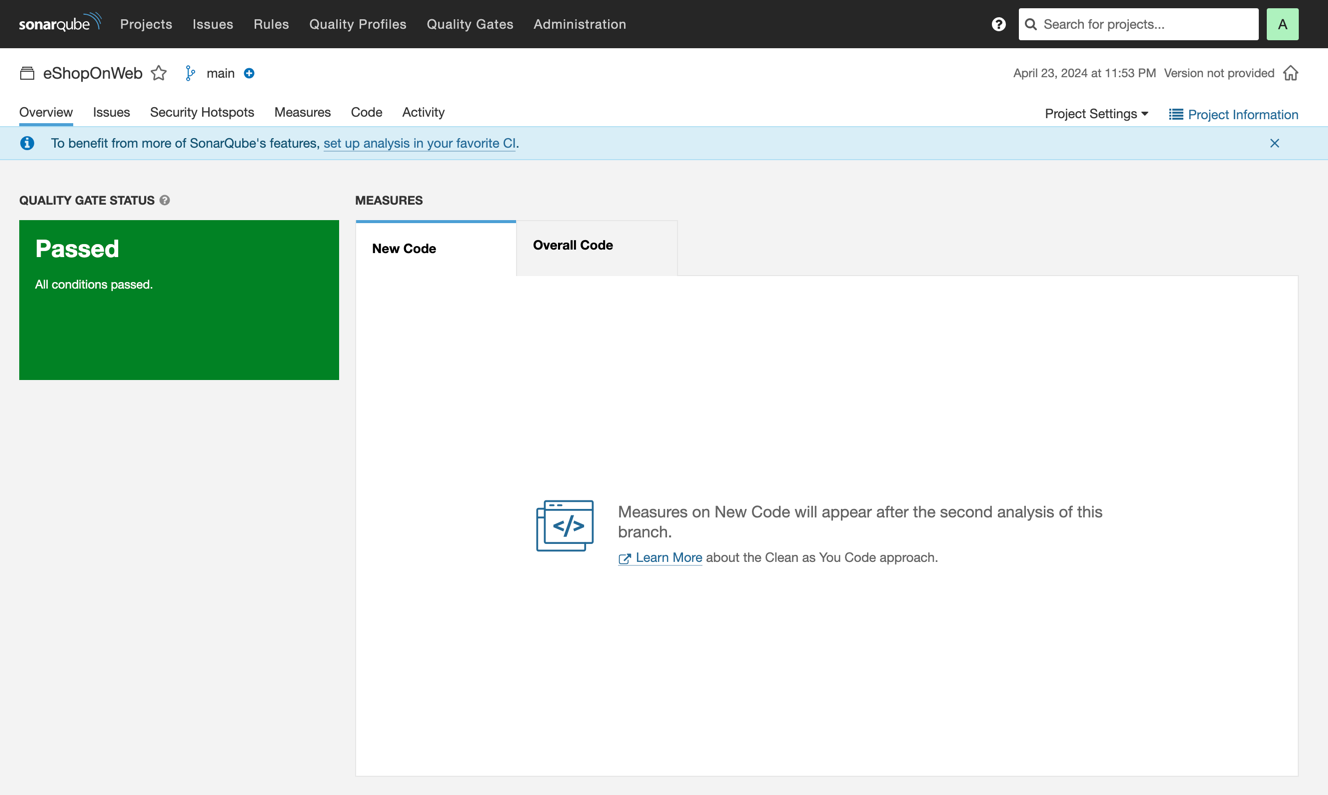
As you make changes to the code, SonarQube Community Build will use this initial analysis as the baseline and report problems it detects in your new code. The quality gate on your new code ensures that you keep it in shape and prevents issues from entering your code base. As a result, the overall quality of your code base will gradually improve over time.
Here's what happens if you introduce a new bug into `eShopOnWeb` by making the constructor of the `UriComposer` class private and running a SonarQube Community Build code scan once again:
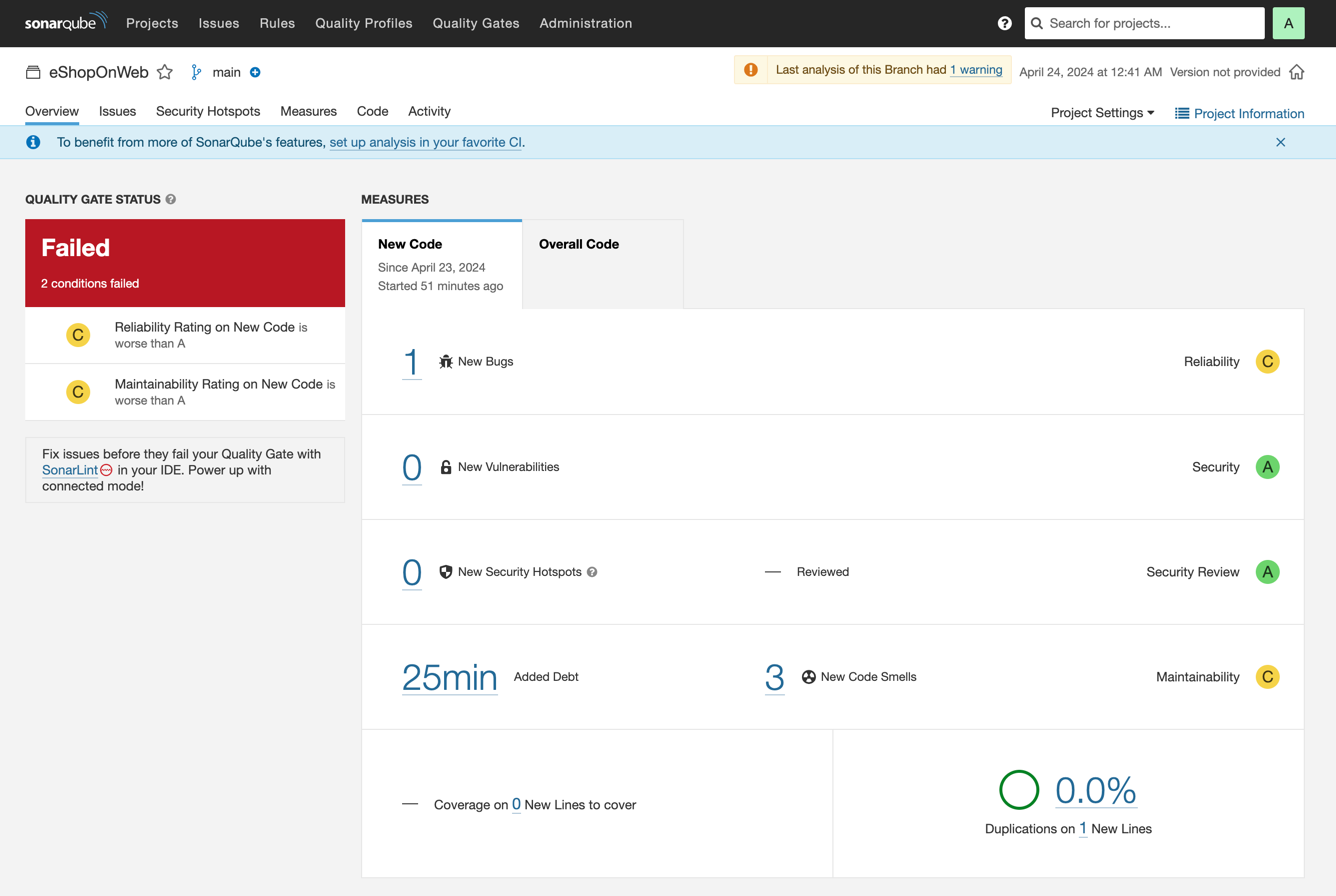
Since SonarQube Community Build's default quality gate requires that no new bugs are introduced, the quality gate for new code fails, prompting you to make fixes and make SonarQube Community Build green again.
Using SonarQube for IDE's Connected Mode in VS Code
While SonarQube Community Build scans your code on demand or automatically on new pushes to your repository, you can also get instant code-quality feedback in your IDE with SonarQube for IDE. It's a free advanced IDE extension that helps maintain Clean Code right as you type and before committing your code.
If you're using Visual Studio Code, install SonarQube for IDE: Visual Studio Code by opening the Extensions pane, searching for SonarQube for IDE, and installing the SonarQube for IDE extension from the search results.
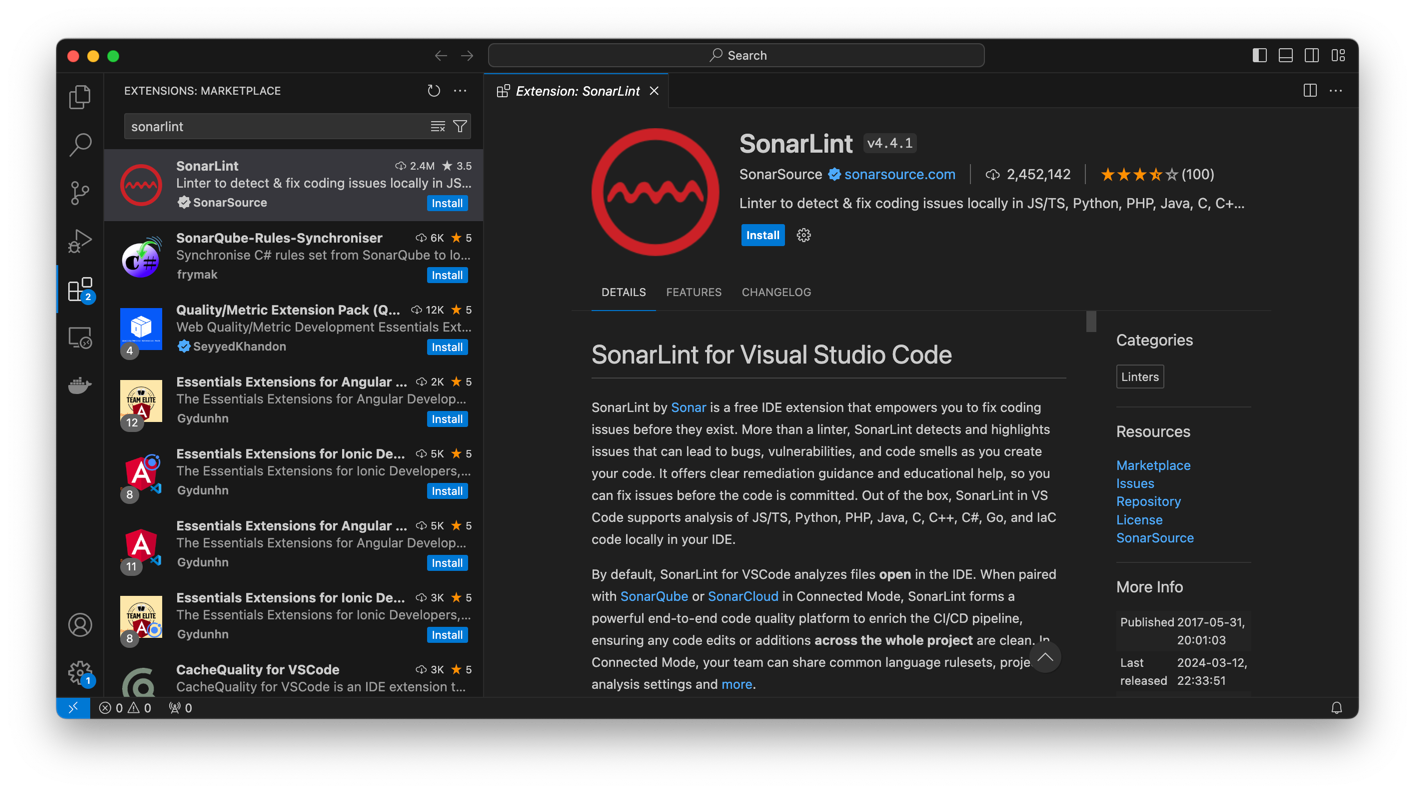
You'll then see code analysis results like those in SonarQube Community Build in the IDE as you code:
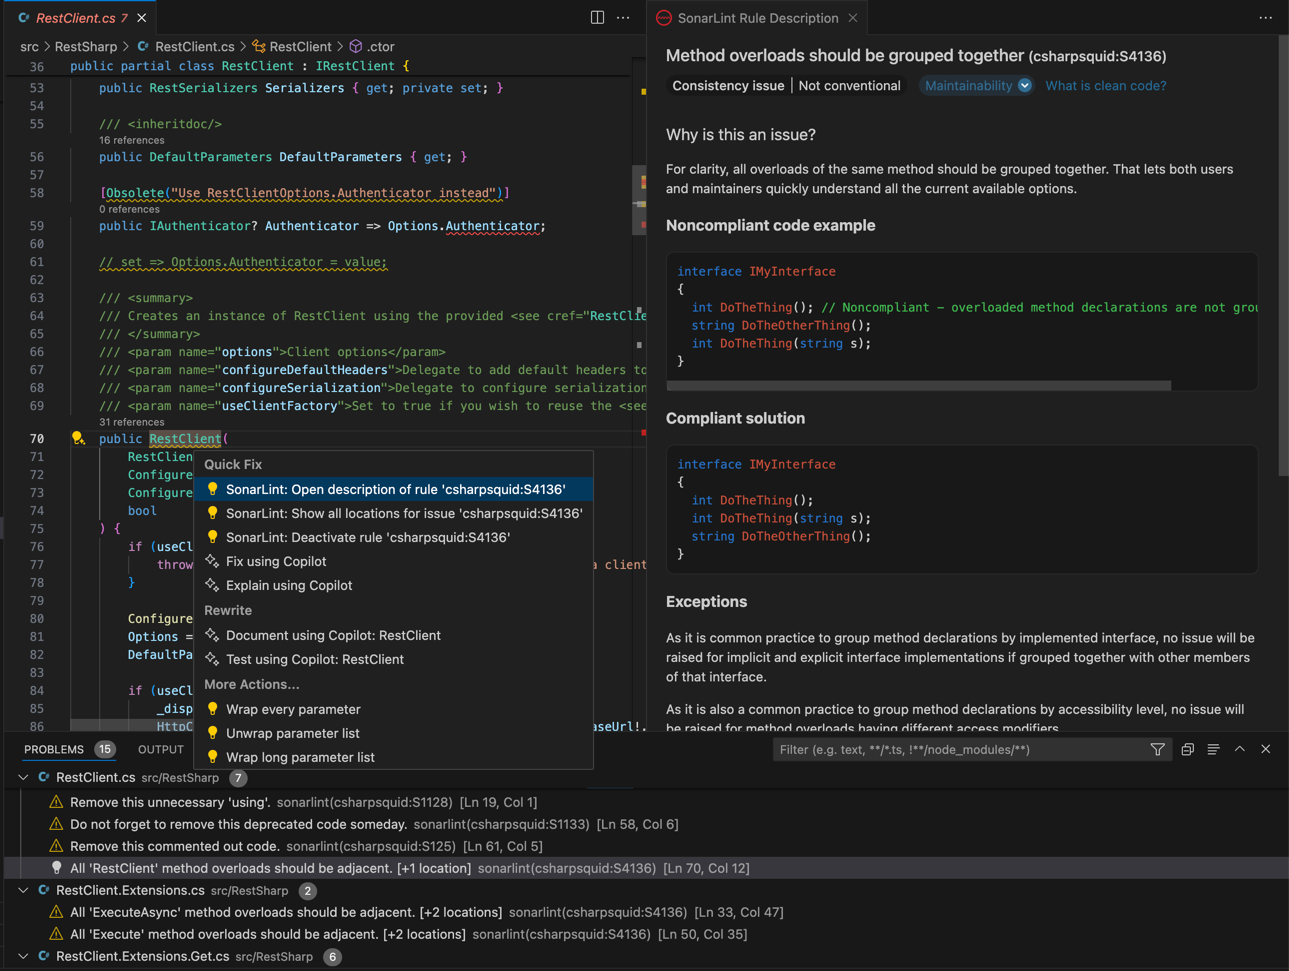
If you're using both SonarQube for IDE for code analysis in the IDE and SonarQube Community Build for code analysis in the repository, Connected Mode unlocks advanced capabilities that are only available when SonarQube for IDE and SonarQube Community Build are paired together. For example, in Connected Mode, SonarQube for IDE flags code issues according to the code-quality rules you configure in SonarQube Community Build.
Summary
Whatever tech stack you use, introducing static code analysis tools into your daily programming workflow helps you maintain Clean Code and avoid spending too much time hunting bugs in production.
In this article, you learned how static code analysis works in SonarQube Server, how to use SonarQube for IDE in the IDE, and how to make the two tools work together.
This guide was written by Jura Gorohovsky.
- August 5, 2024

