VS Code has been gaining popularity for C and C++ development. We are happy to announce that finally, we will be able to help you write clean C and C++ code in VS Code.
In this blog post, we will take you on a quick tour to discover the essentials of SonarQube for IDE: Visual Studio Code. We hope you enjoy the ride!
All you need is a Compilation Database
That’s all it takes to configure the analysis. Compilation databases are pretty standard. So, you may already generate one for your project. If not, here are a few hints to help.
You can configure your compilation database in 3 ways:
- By using the SonarQube for IDE notification
- Through SonarQube for IDE embedded action
- By manually assigning the `SonarQube for IDE.pathToCompileCommands` option in the settings to the full path of the compilation database.
You can also use the SonarQube for IDE embedded action to switch quickly between different configurations.

It is alive!
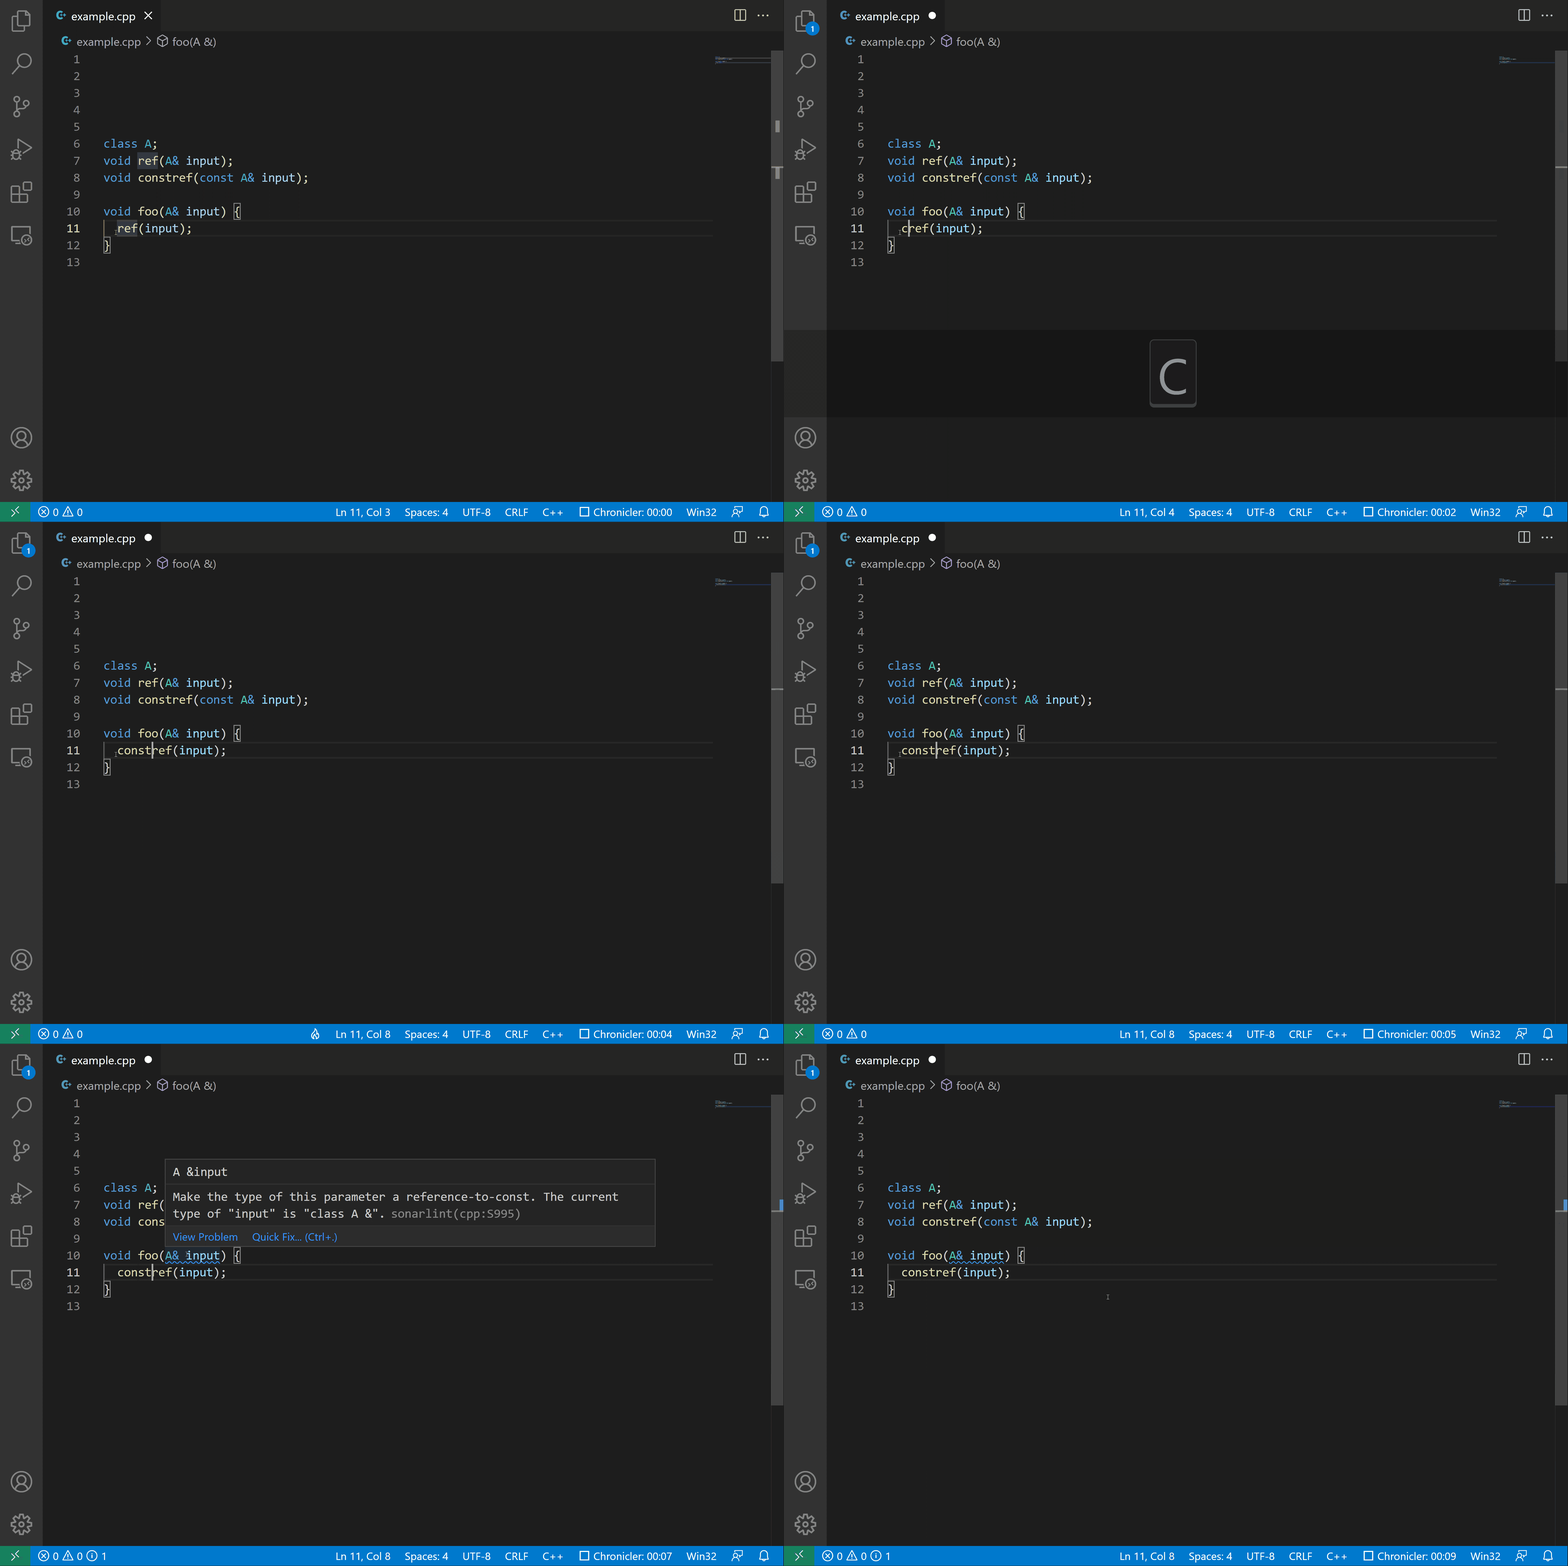
SonarQube for IDE is alive. It is constantly watching your code for you. It automatically analyzes your code as you type and raises issues as soon as they are detected.
All the relevant information and fixes are there when you need them. No need to ask for them; they come to you.

The rule
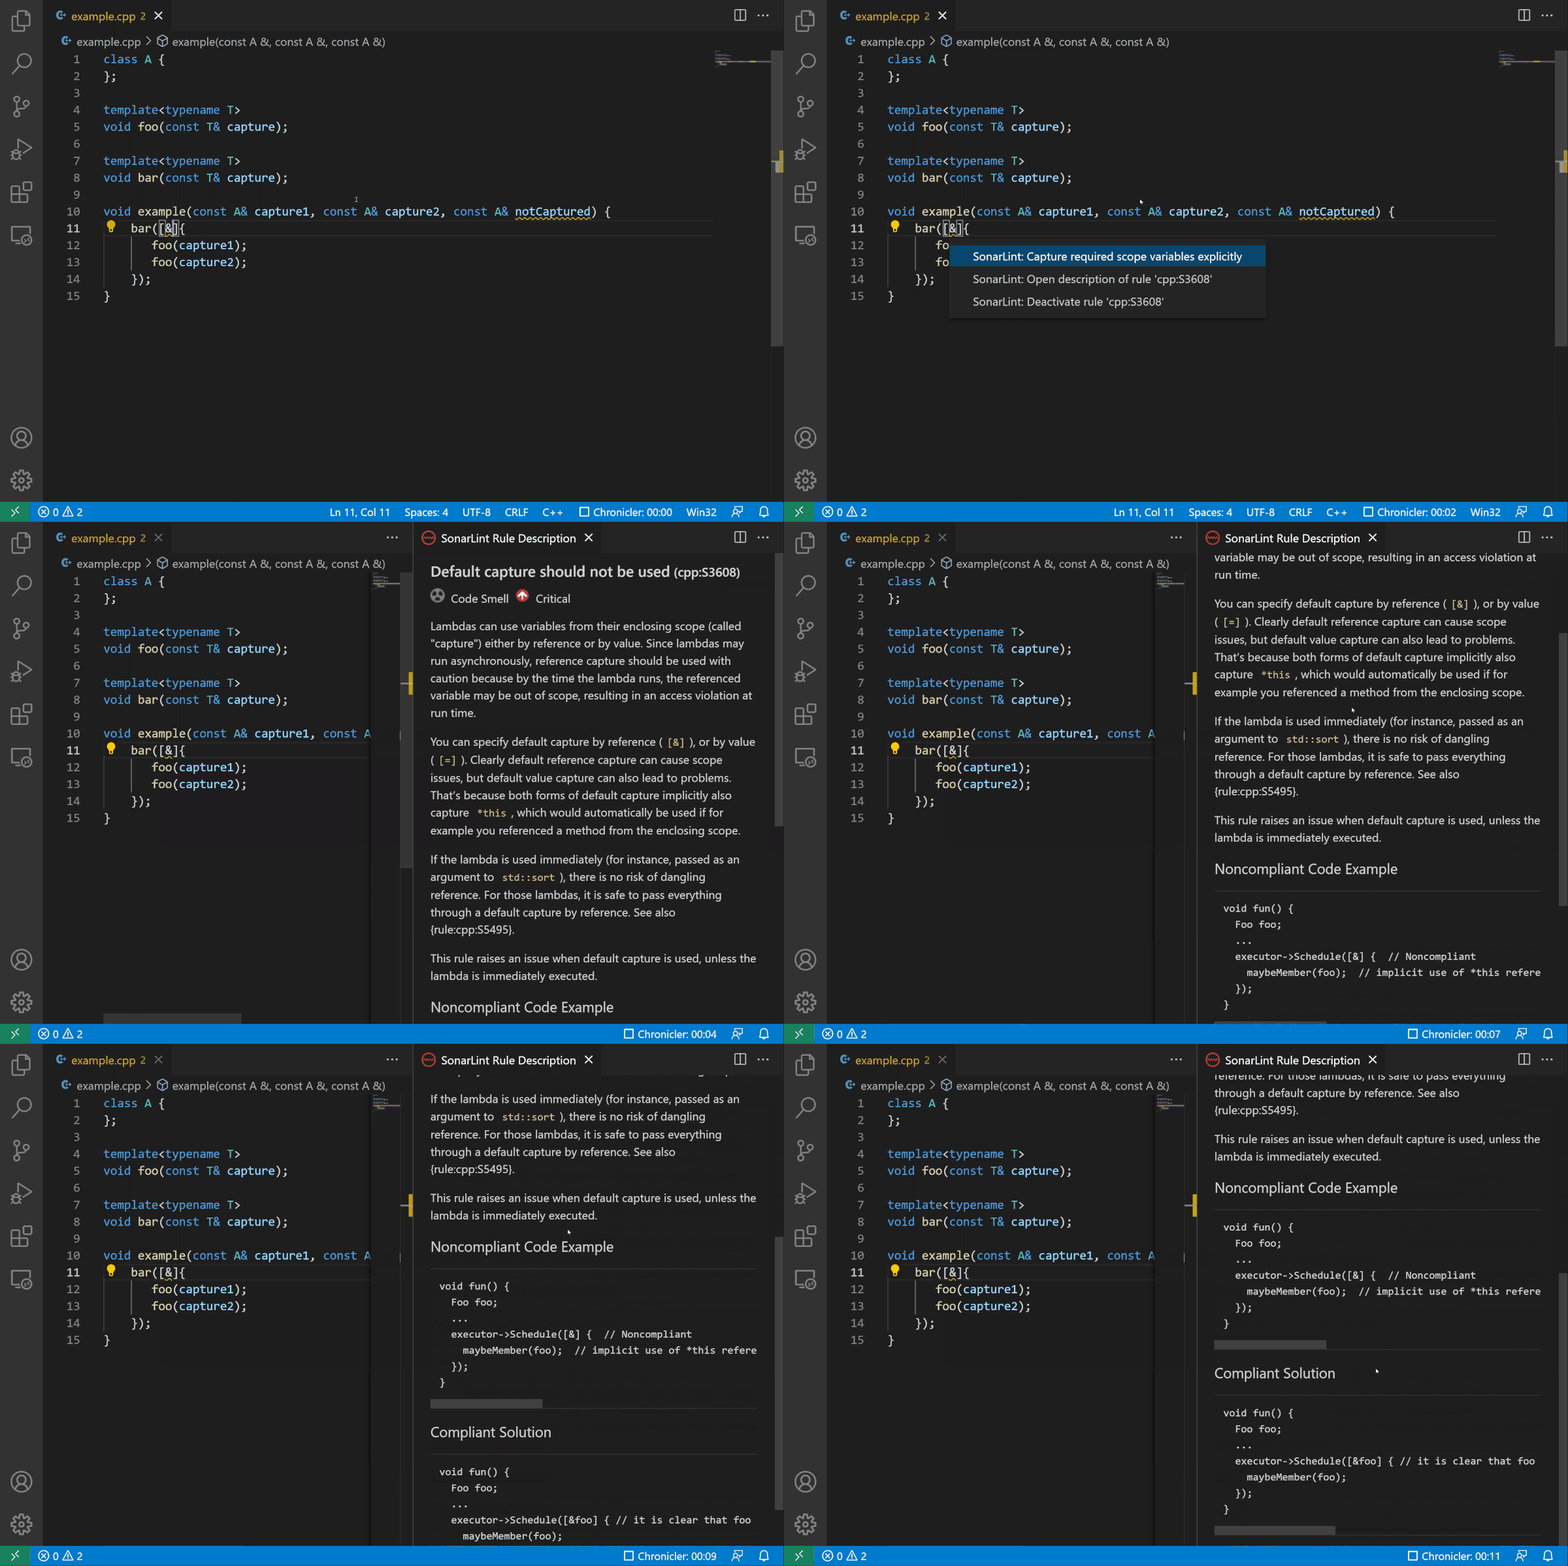
The first step to fixing an issue is understanding its corresponding rule.
For certain rules, the title is enough to understand the rule; for others, you may want to get more information. Here, SonarQube for IDE helps you by making the rule description quickly accessible from the issue. The description contains the motivation behind the rule, examples of code breaking the rule, and good ways to fix the code.

The issue
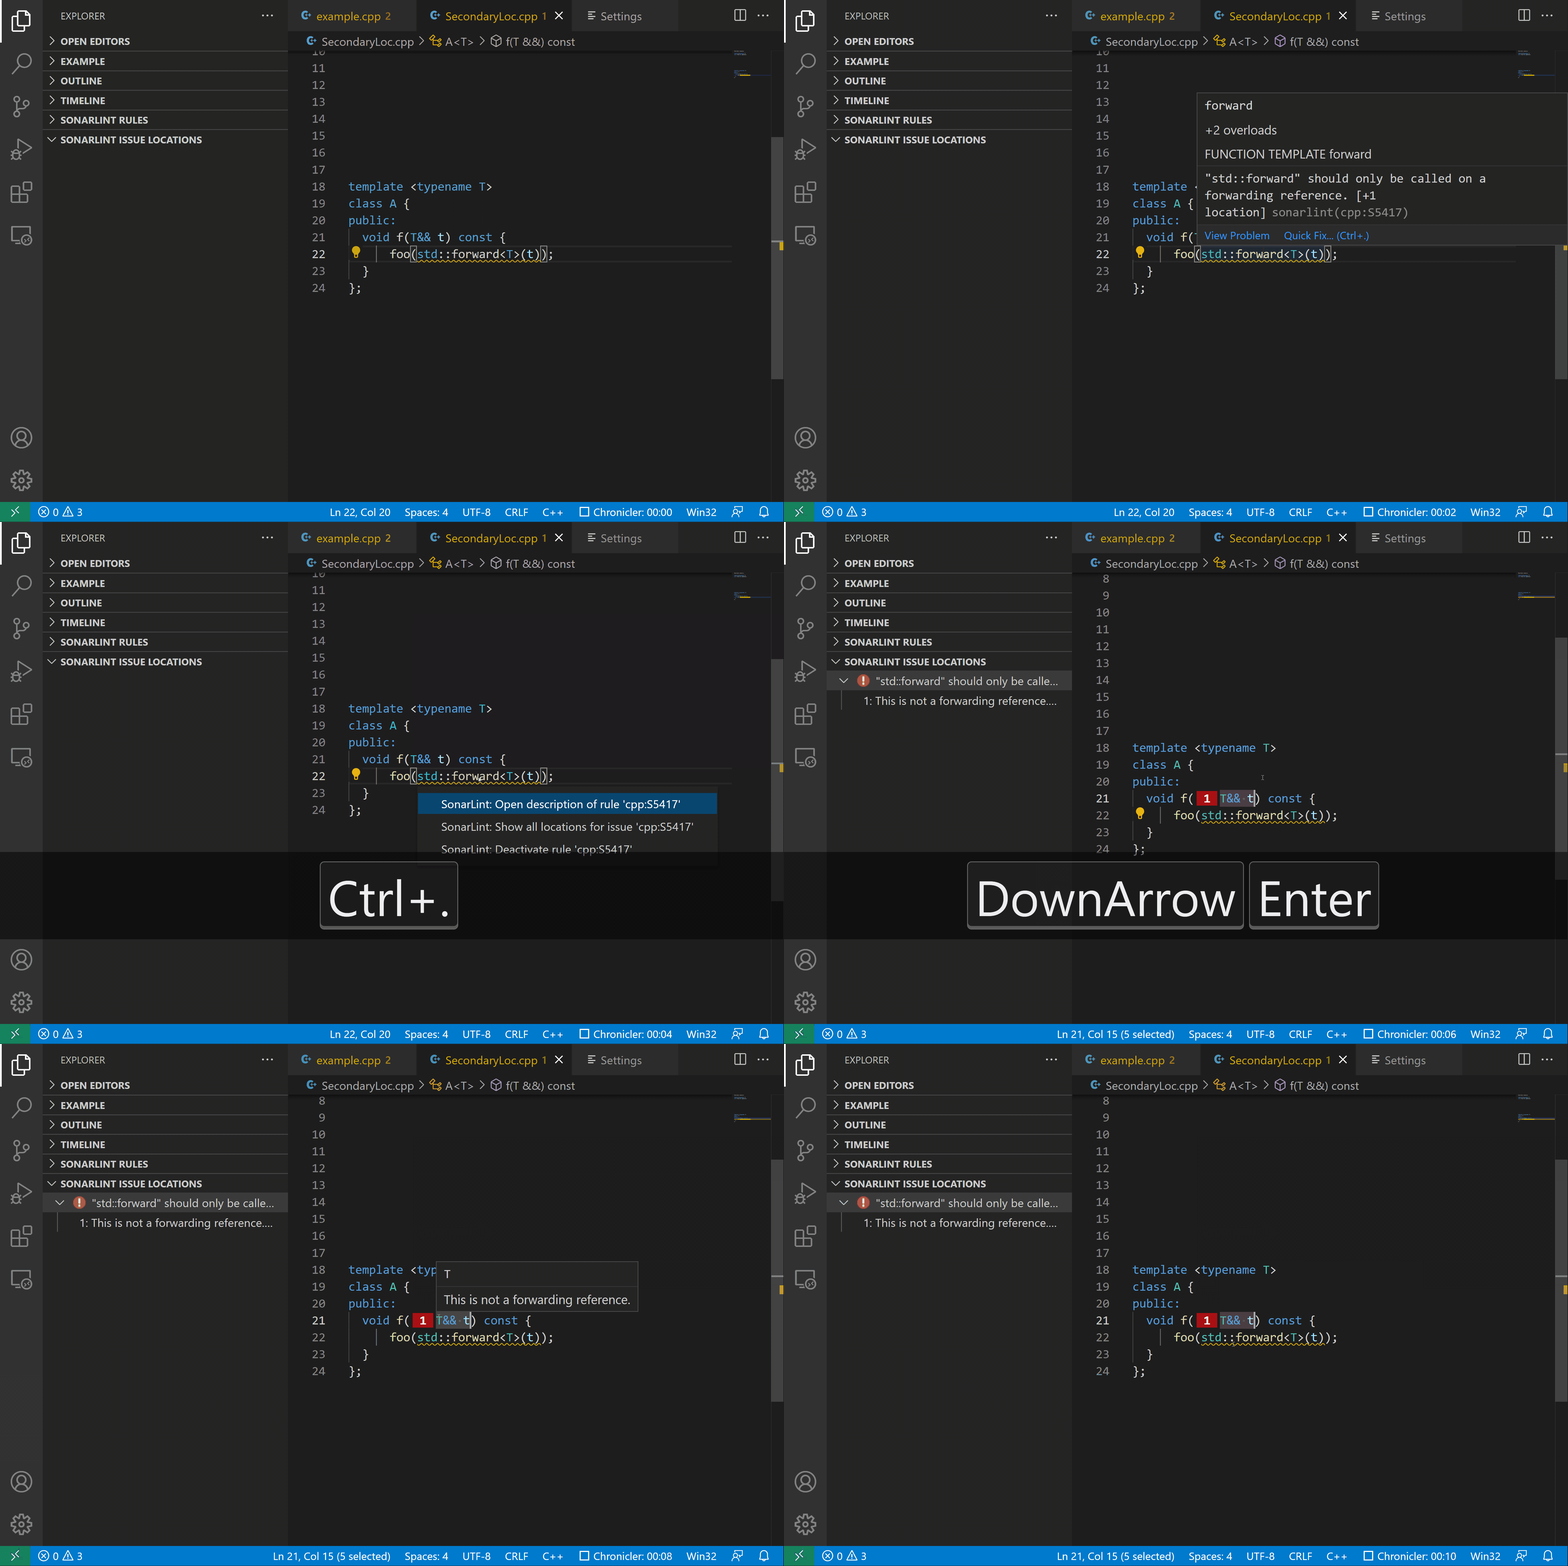
Once the rule is clear, you can see where and how the issue unfolds in your code. Understanding the issue can quickly become complex in some cases:
- If the issue depends on a hidden context, for example, a function prototype written in another file.
- When the issue describes a path-sensitive bug where you have to understand a long cross-functional control flow, for example, when a `nullptr` is initialized in one function and dereferenced in another.
To solve this problem, SonarQube for IDE provides multiple issue locations when needed.

… and the fix
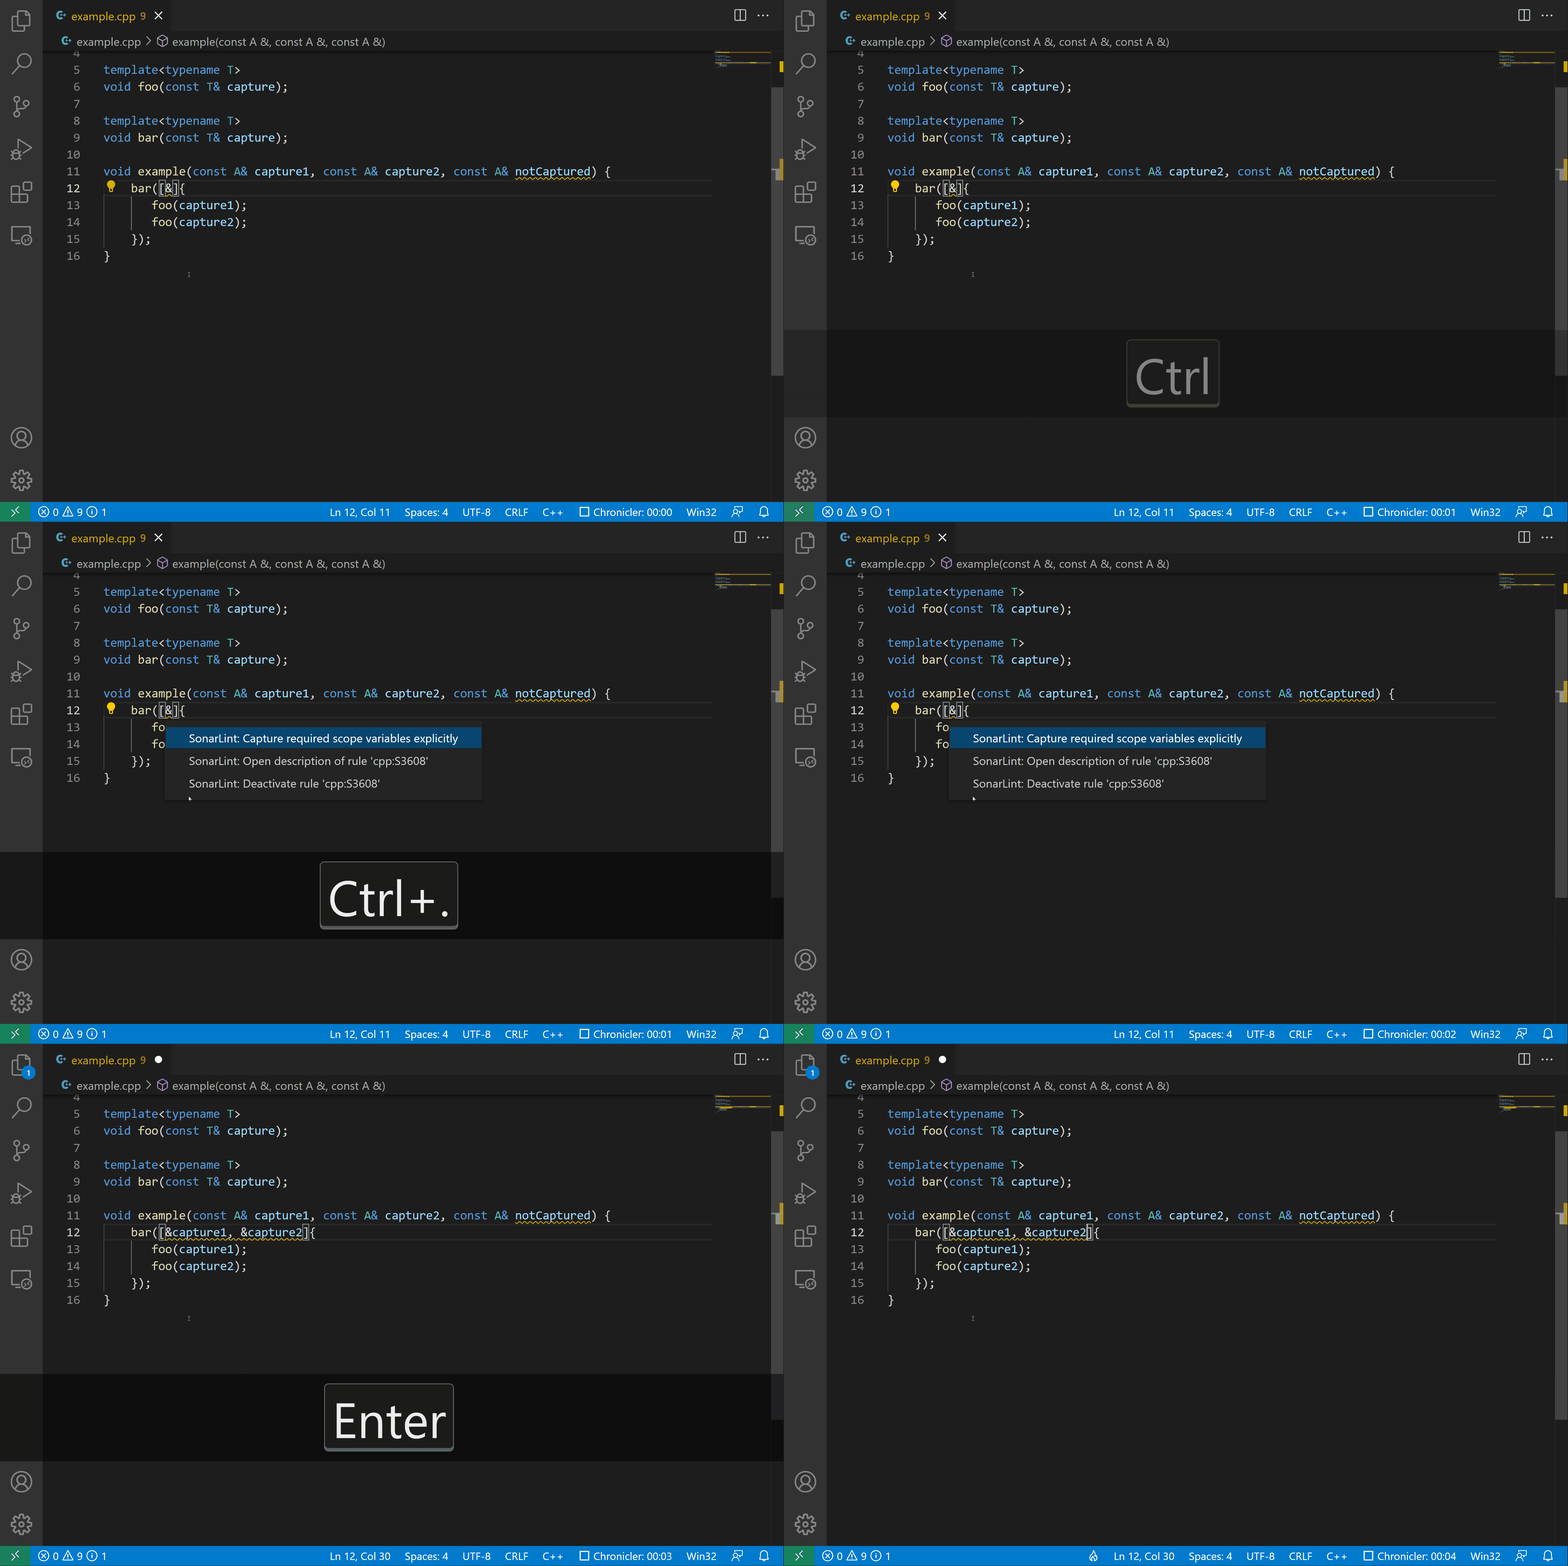
Finally, comes the time to fix the issue. SonarQube for IDE helps you by showing you how to write fixes. As explained earlier, all rules have generic fix suggestions in their description. Quick fixes are also available to fix issues automatically for specific rules and situations. They allow you to learn while coding, making you faster in fixing and improving your code.

That’s all, folks!
Of course, there is more to SonarQube for IDE; there are many other features for you to discover, for example:
- Rule enabling and disabling
- Connected mode to SonarQube Server and SonarQube Cloud. This allows synchronizing which rules run and what issues are shown in your SonarQube for IDE, allowing a developer team to share clean code information and practices straight in their IDE.
To get started, check out our technical documentation. Also, If you use other IDEs to write C or C++, SonarQube for IDE is waiting for you in CLion, Eclipse, and Visual Studio, too.
If you run into any issues or would like to provide feedback, please reach out to us on our community forum.

