

Key Information
- During our continuous scans of open-source code, SonarQube reported a Cross-Site Scripting (XSS) hotspot in Grafana, a popular observability platform.
- We confirmed the vulnerability and reported it to the Grafana team, who implemented a fix. See more information in their release blog.
- The vulnerability is tracked as CVE-2025-2703 and has been fixed in Grafana version 11.6.0+security-01 and backported to all currently supported versions.
- Attackers could exploit the vulnerability to steal data from other users or elevate their privileges by targeting users with more permissions.
- Unpatched Grafana instances are vulnerable in their default configuration, affecting the open-source (OSS) and Enterprise versions.
- Mass exploitation is unlikely because the vulnerability requires the attacker to be authenticated and have panel editing permissions.
We regularly scan open-source projects to make the software landscape more secure and to improve our security analysis capabilities. In ever-growing code bases and with the rise of AI-assisted programming, there is more and more code that needs to be reviewed for security vulnerabilities and other issues. This underlines the need for automated code analysis to keep vulnerabilities from reaching production because, as we will see today, this can still happen in high-profile, well-tested codebases like Grafana's.
SonarQube detected a Cross-Site Scripting (XSS) vulnerability (CVE-2025-2703) in Grafana, a prominent open-source data analytics and visualization solution. We manually verified the vulnerability and reported it to Grafana. The vulnerability allows an authenticated attacker with editor permission to execute arbitrary JavaScript in a victim's session when a dashboard is viewed. Due to these exploit requirements, we deem mass-exploitation very unlikely and are therefore sharing our findings today.
In this blog post, we will first learn about the potential impact of the vulnerability and then dive into its technical details to understand how it works. Finally, we will learn about Grafana's patch and how you can avoid such vulnerabilities in your code.
View report on SonarQube Cloud
Impact
The vulnerability, tracked as CVE-2025-2703, existed in Grafana since version 11.1.0, which was released 10 months ago. The issue was fixed in version 11.6.0+security-01 and backported to all currently supported versions, so we highly recommend updating your instance. You can find more details in Grafana's release blog.
By exploiting the vulnerability, an attacker can store a malicious JavaScript payload in the configuration of a dashboard panel that will be executed in a victim's Grafana session when they visit an infected dashboard. This allows them to steal data from other users or elevate their privileges by targeting users with more permissions.
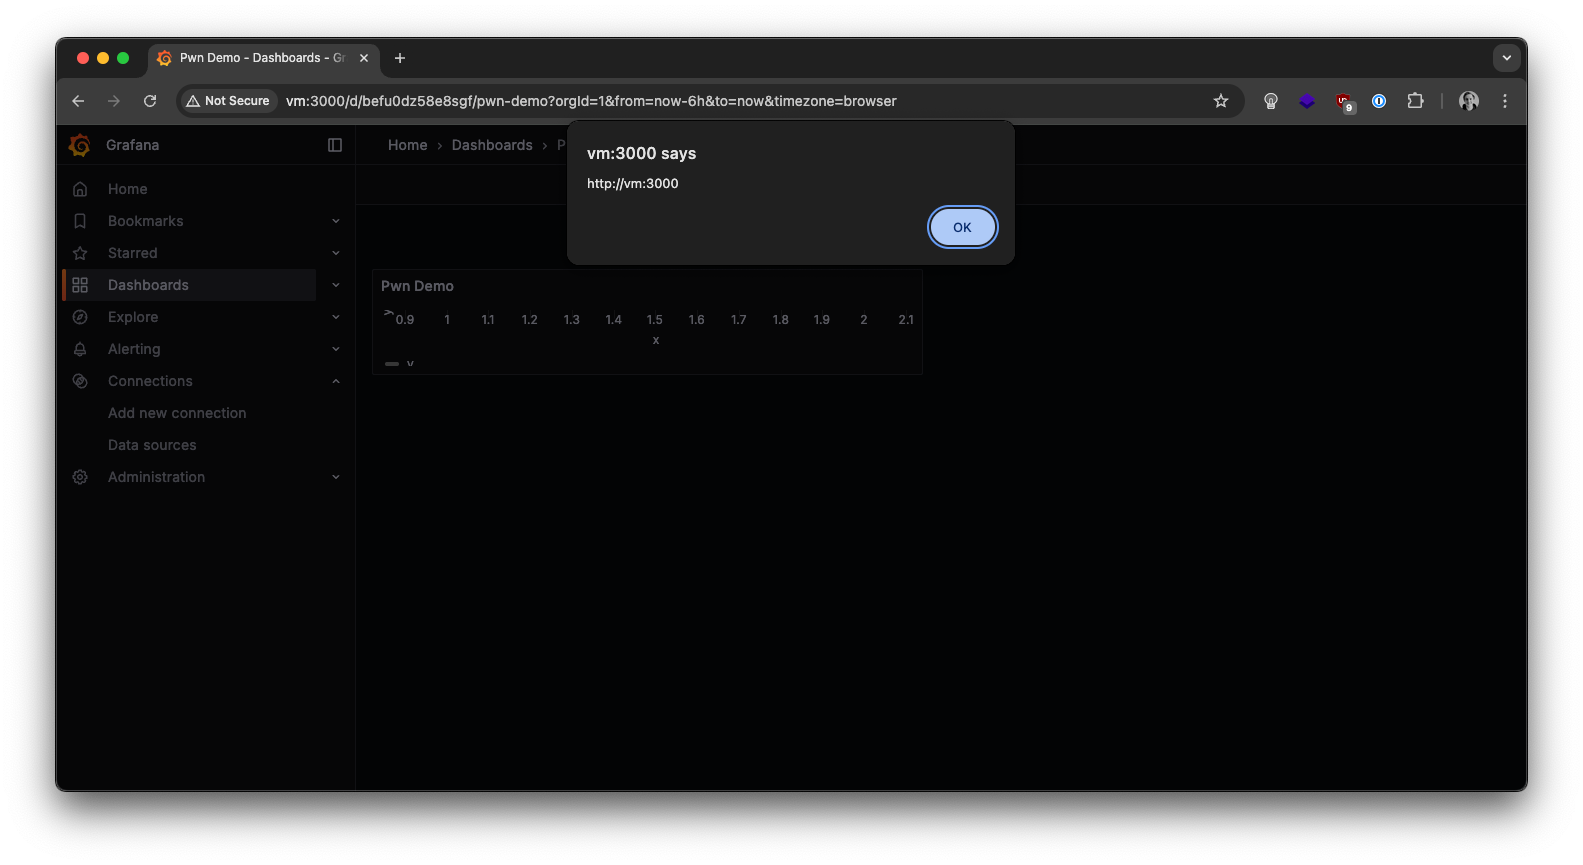
The attacker needs editor permissions for a dashboard panel to abuse the vulnerability. Since the vulnerability exists in the built-in XY Charts plugin, unpatched Grafana instances are vulnerable by default. A successful attack is demonstrated in a test environment here:
CVE-2025-2703: Technical Details
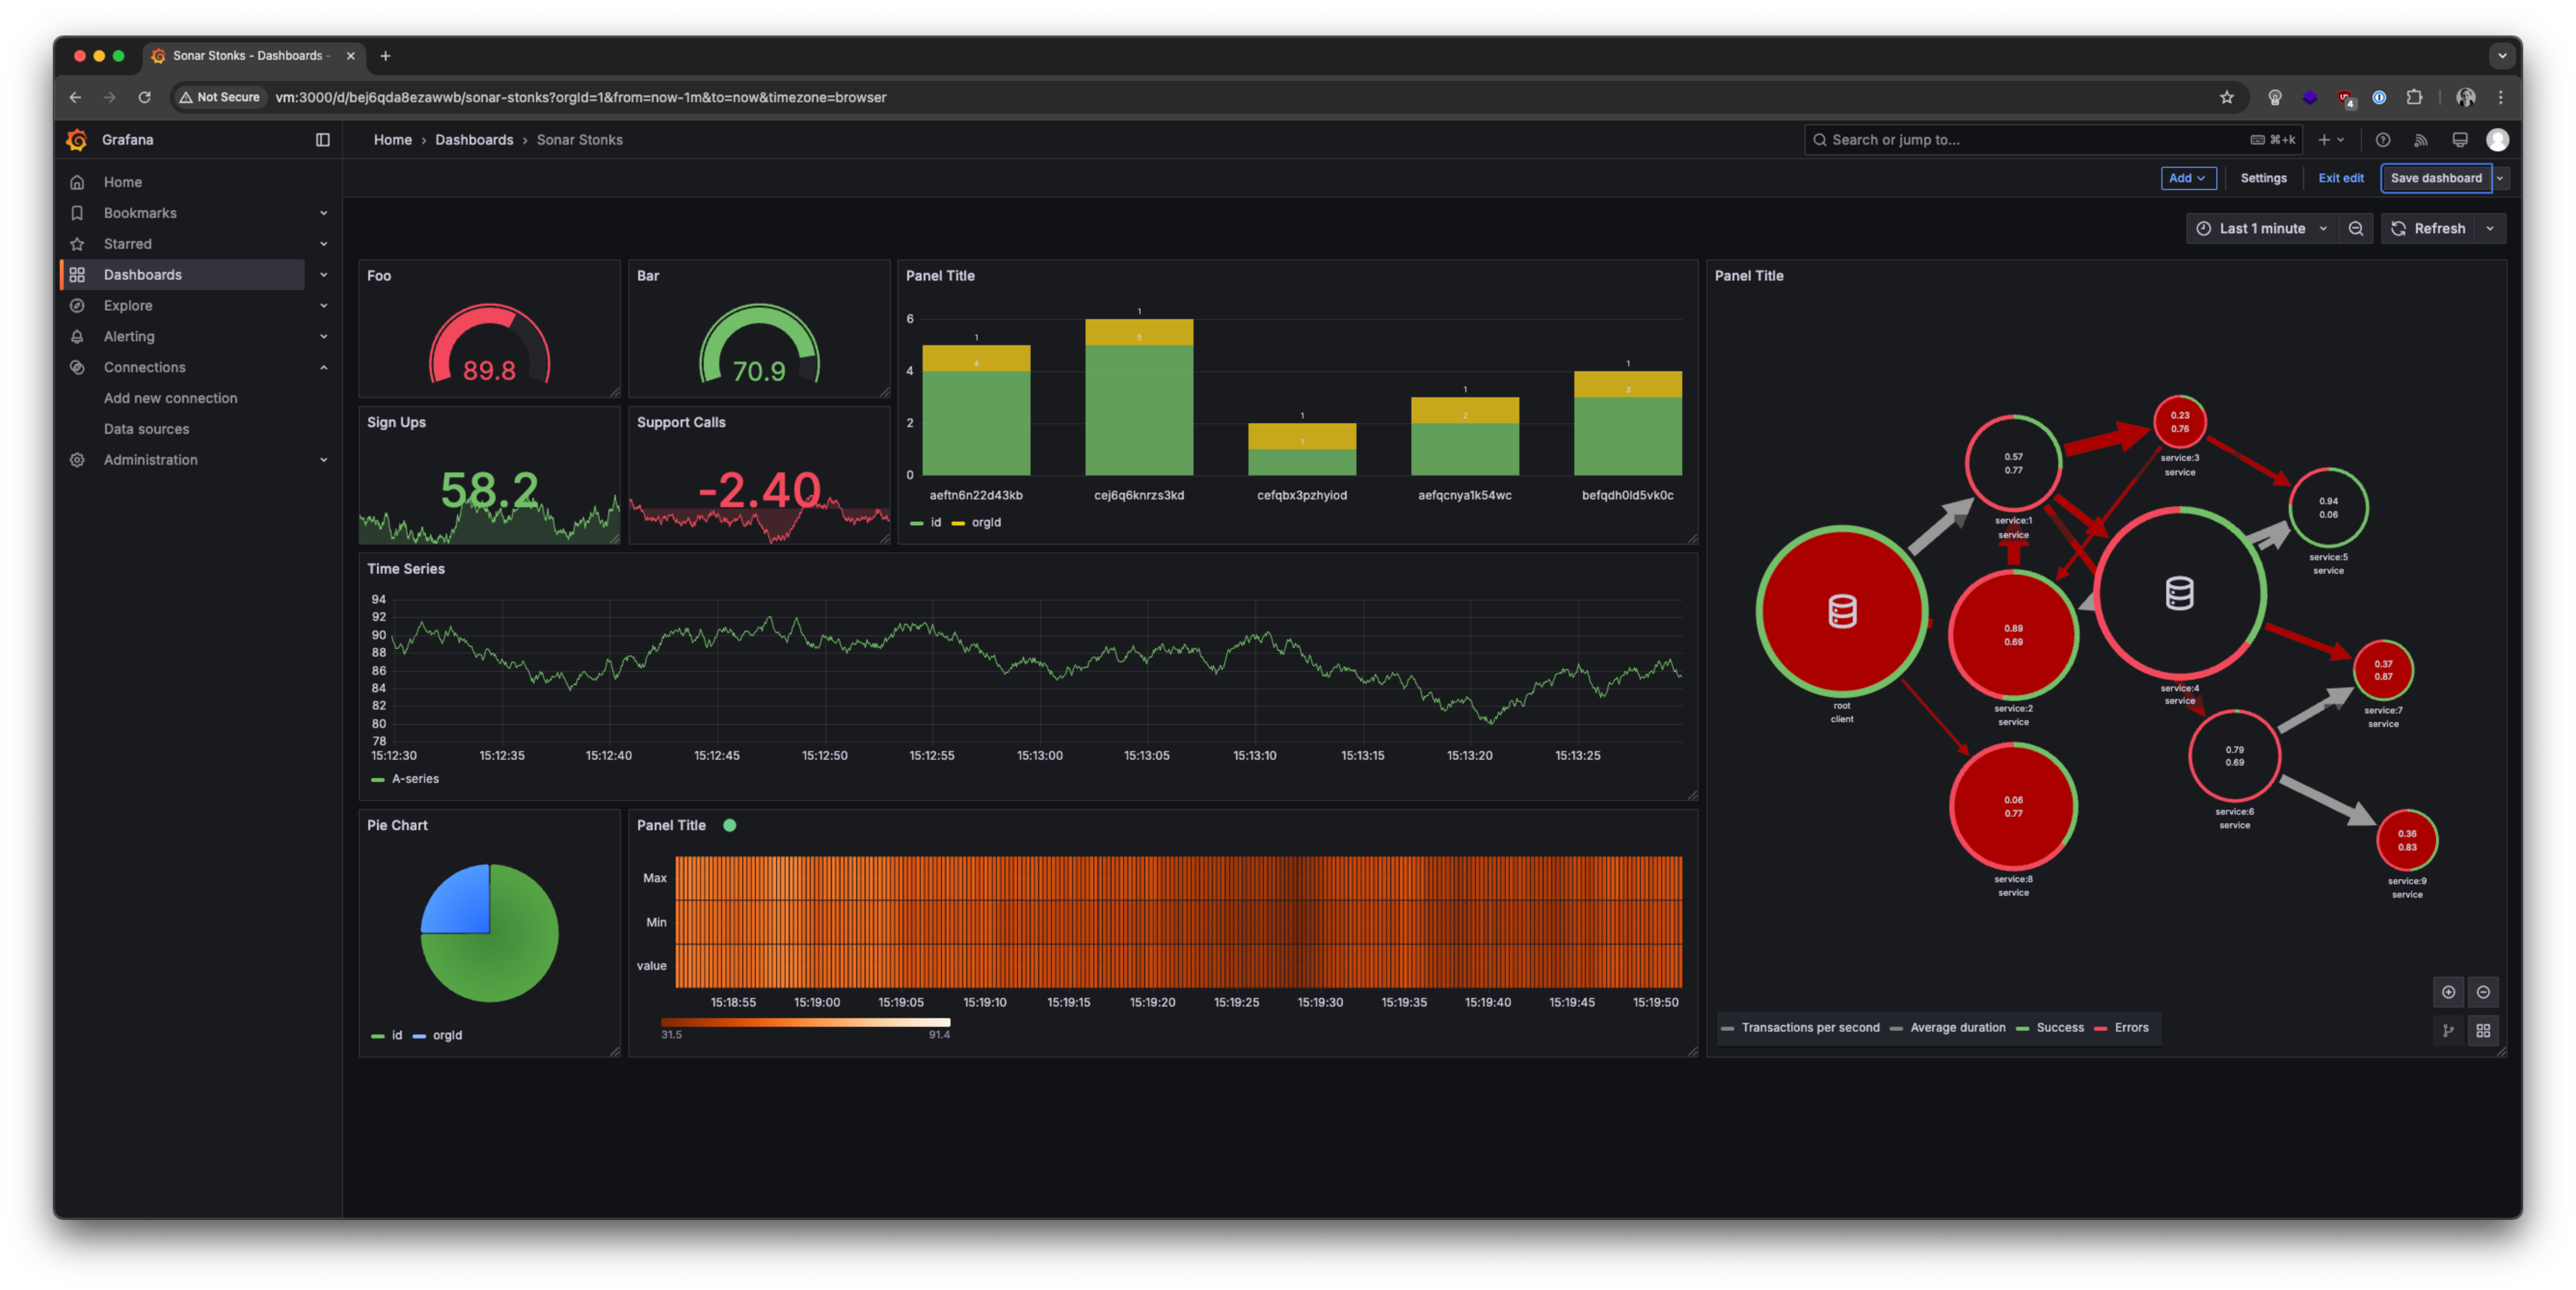
Grafana uses the concept of dashboards that contain one or more panels. These visualize data from various sources and can be configured in many different ways, making Grafana a versatile tool:
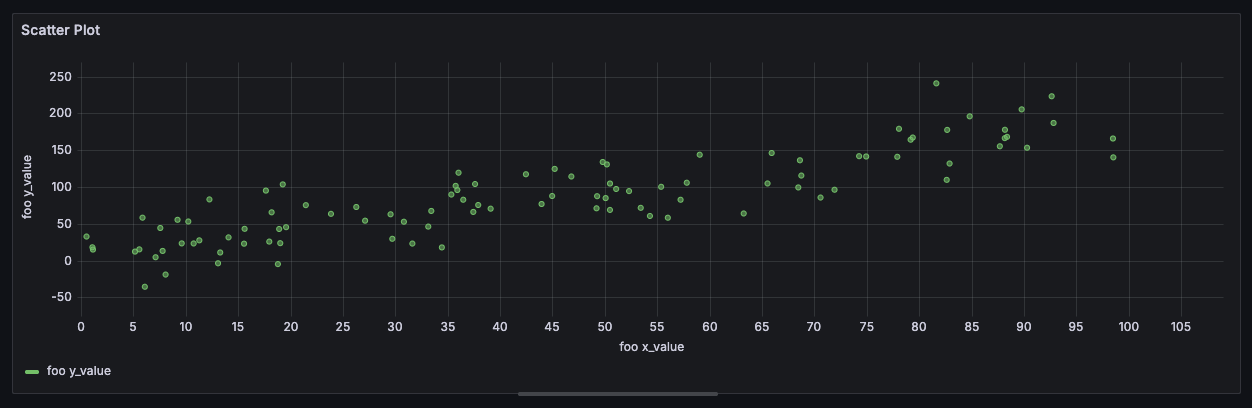
To cover many common use cases, Grafana comes with a series of built-in plugins that provide basic functionality, such as basic chart types. One of these plugins, the XY Chart plugin, is responsible for drawing scatter plots from data points:
The chart can be styled in many ways, such as by changing the color of the data points on the grid. The color can be either controlled by a static value or by defining thresholds. Under the hood, the threshold conditions have to be evaluated for every data point to derive its color. To avoid performance issues with large amounts of data points, Grafana creates a native JavaScript function based on the threshold conditions. This function is then executed for each data point during the chart rendering.
However, the approach of creating a JavaScript function from potentially untrusted input comes with a big risk: if parts of the input are being interpolated into the function's code in an unsafe way, an attacker could use it to inject arbitrary JavaScript code! Let's take a look at the issue that SonarQube raised:
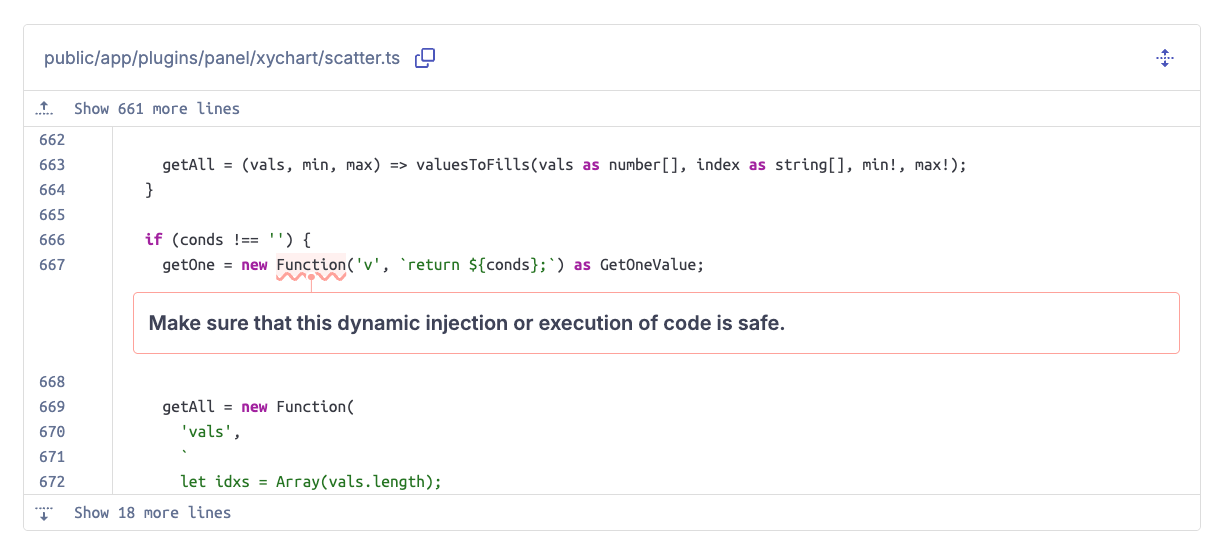
As we can see, SonarQube flags the dangerous creation of a JavaScript function based on a non-static string as a security hotspot. By investigating the function that contains this code snippet, fieldValueColors(), we can see how the function's code is built. We omitted a lot of code here as the function is quite big, but we can see that part of the code is resulting from a config object (f.config):
public/app/plugins/panel/xychart/scatter.ts:
function fieldValueColors(f: Field, theme: GrafanaTheme2): FieldColorValues {
  // ...
  let conds = '';
  if (f.config.mappings?.length ?? 0 > 0) {
    // ...
  } else if (f.config.color?.mode === FieldColorModeId.Thresholds) {
    if (f.config.thresholds?.mode === ThresholdsMode.Absolute) {
      let steps = f.config.thresholds.steps;
      let lasti = steps.length - 1;
      for (let i = lasti; i > 0; i--) {
        conds += `v >= ${steps[i].value} ? ${i} : `;
      }
      // ...
    } else {
      // ...
    }
  }
  // ...
  if (conds !== '') {
    getOne = new Function('v', `return ${conds};`) as GetOneValue;
    // ...
  }
  // ...
}
This config object contains values that we can change while editing the panel. The values in the thresholds.steps array are inserted into the function's code without escaping or sanitizing them in line 11. It looks like this is indeed a vulnerability! However, this requires that these values are not sanitized by the server from which the config is coming.
Next to its editor UI, Grafana also allows modifying a panel by directly editing its JSON representation:
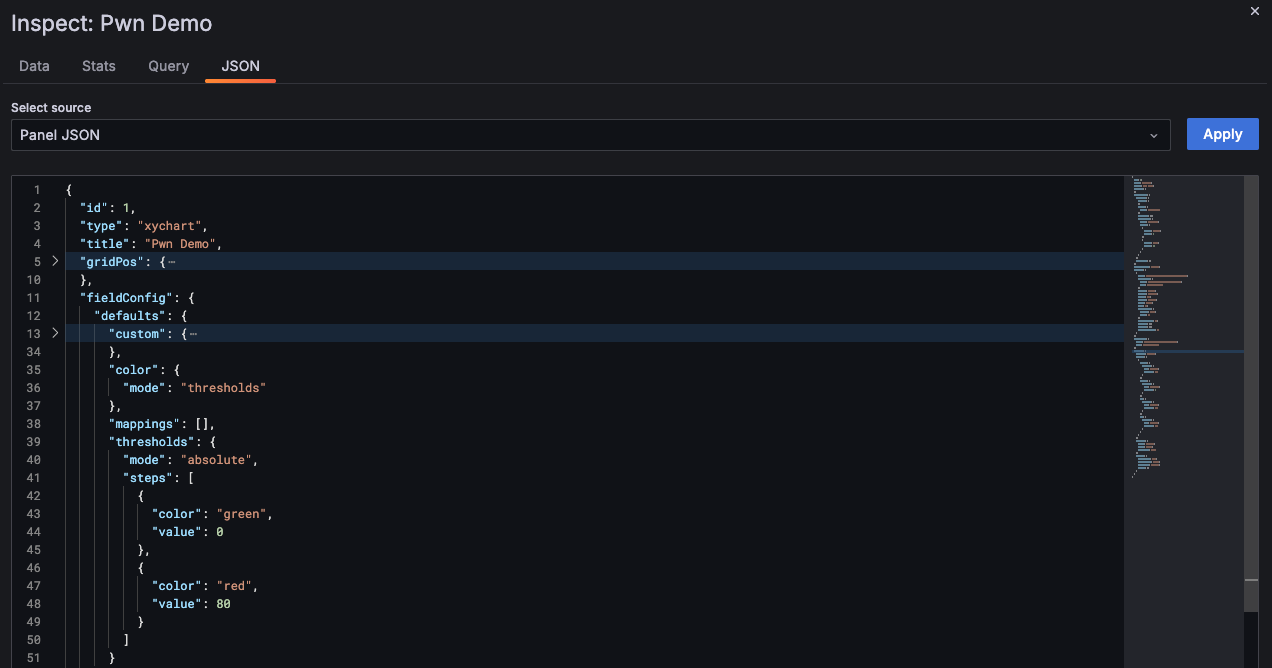
Here we can see that it has the same structure as what the fieldValueColors() function expects. The current values are all numbers, this is also what the function expects since it uses the greater-than comparison operator with these values. However, since the panel is stored as JSON, an attacker could simply replace the numbers with strings that contain JavaScript code! We can see that this indeed works, indicating the server does not validate or sanitize them:
With this, we have successfully validated that the security hotspot raised by SonarQube is a real vulnerability. We immediately reported the issue to the Grafana team, so let's see how they fixed it next.
Patch
To prevent such vulnerabilities, make sure to properly escape or sanitize untrusted input before using it to build and execute JavaScript code. Grafana fixed the vulnerability by converting the threshold value to a number:
- conds += `v >= ${steps[i].value} ? ${i} : `;
+ let rhs = Number(steps[i].value);
+ conds += `v >= ${rhs} ? ${i} : `;
Timeline
Summary
In this blog post, we learned about an impactful Cross-Site Scripting vulnerability in the code of Grafana, a popular data analytics solution. We showed how our open-source scanning effort works, from SonarQube raising an issue, to understanding and verifying the vulnerability, to reporting it to the vendor.
The vulnerability itself shows once again that even well-tested codebases have security issues. With more and more code written by humans and AI, it is crucial to implement continuous code scanning to catch the bugs that developers miss.
It is also interesting to observe a correlation between Cognitive Complexity and vulnerable code. SonarQube flags the vulnerable function not only because of the vulnerability, but also because it is long and contains many nested loops and if statements. This makes it harder for humans to fully understand the implementation and makes it easy to lose track of user input flowing into dangerous functions.
Finally, we want to thank the Grafana team for their remediation and good communication during the disclosure.
Related Blog Posts
- Announcing SonarQube Advanced Security
- The Power of Taint Analysis: Uncovering Critical Code Vulnerability in OpenAPI Generator
- Sanitize Client-Side: Why Server-Side HTML Sanitization is Doomed to Fail
- Beware the Cookie Monster: Cyberhaven Extension Vulnerability Allowed Cookie Theft
- Never Underestimate CSRF: Why Origin Reflection is a Bad Idea